
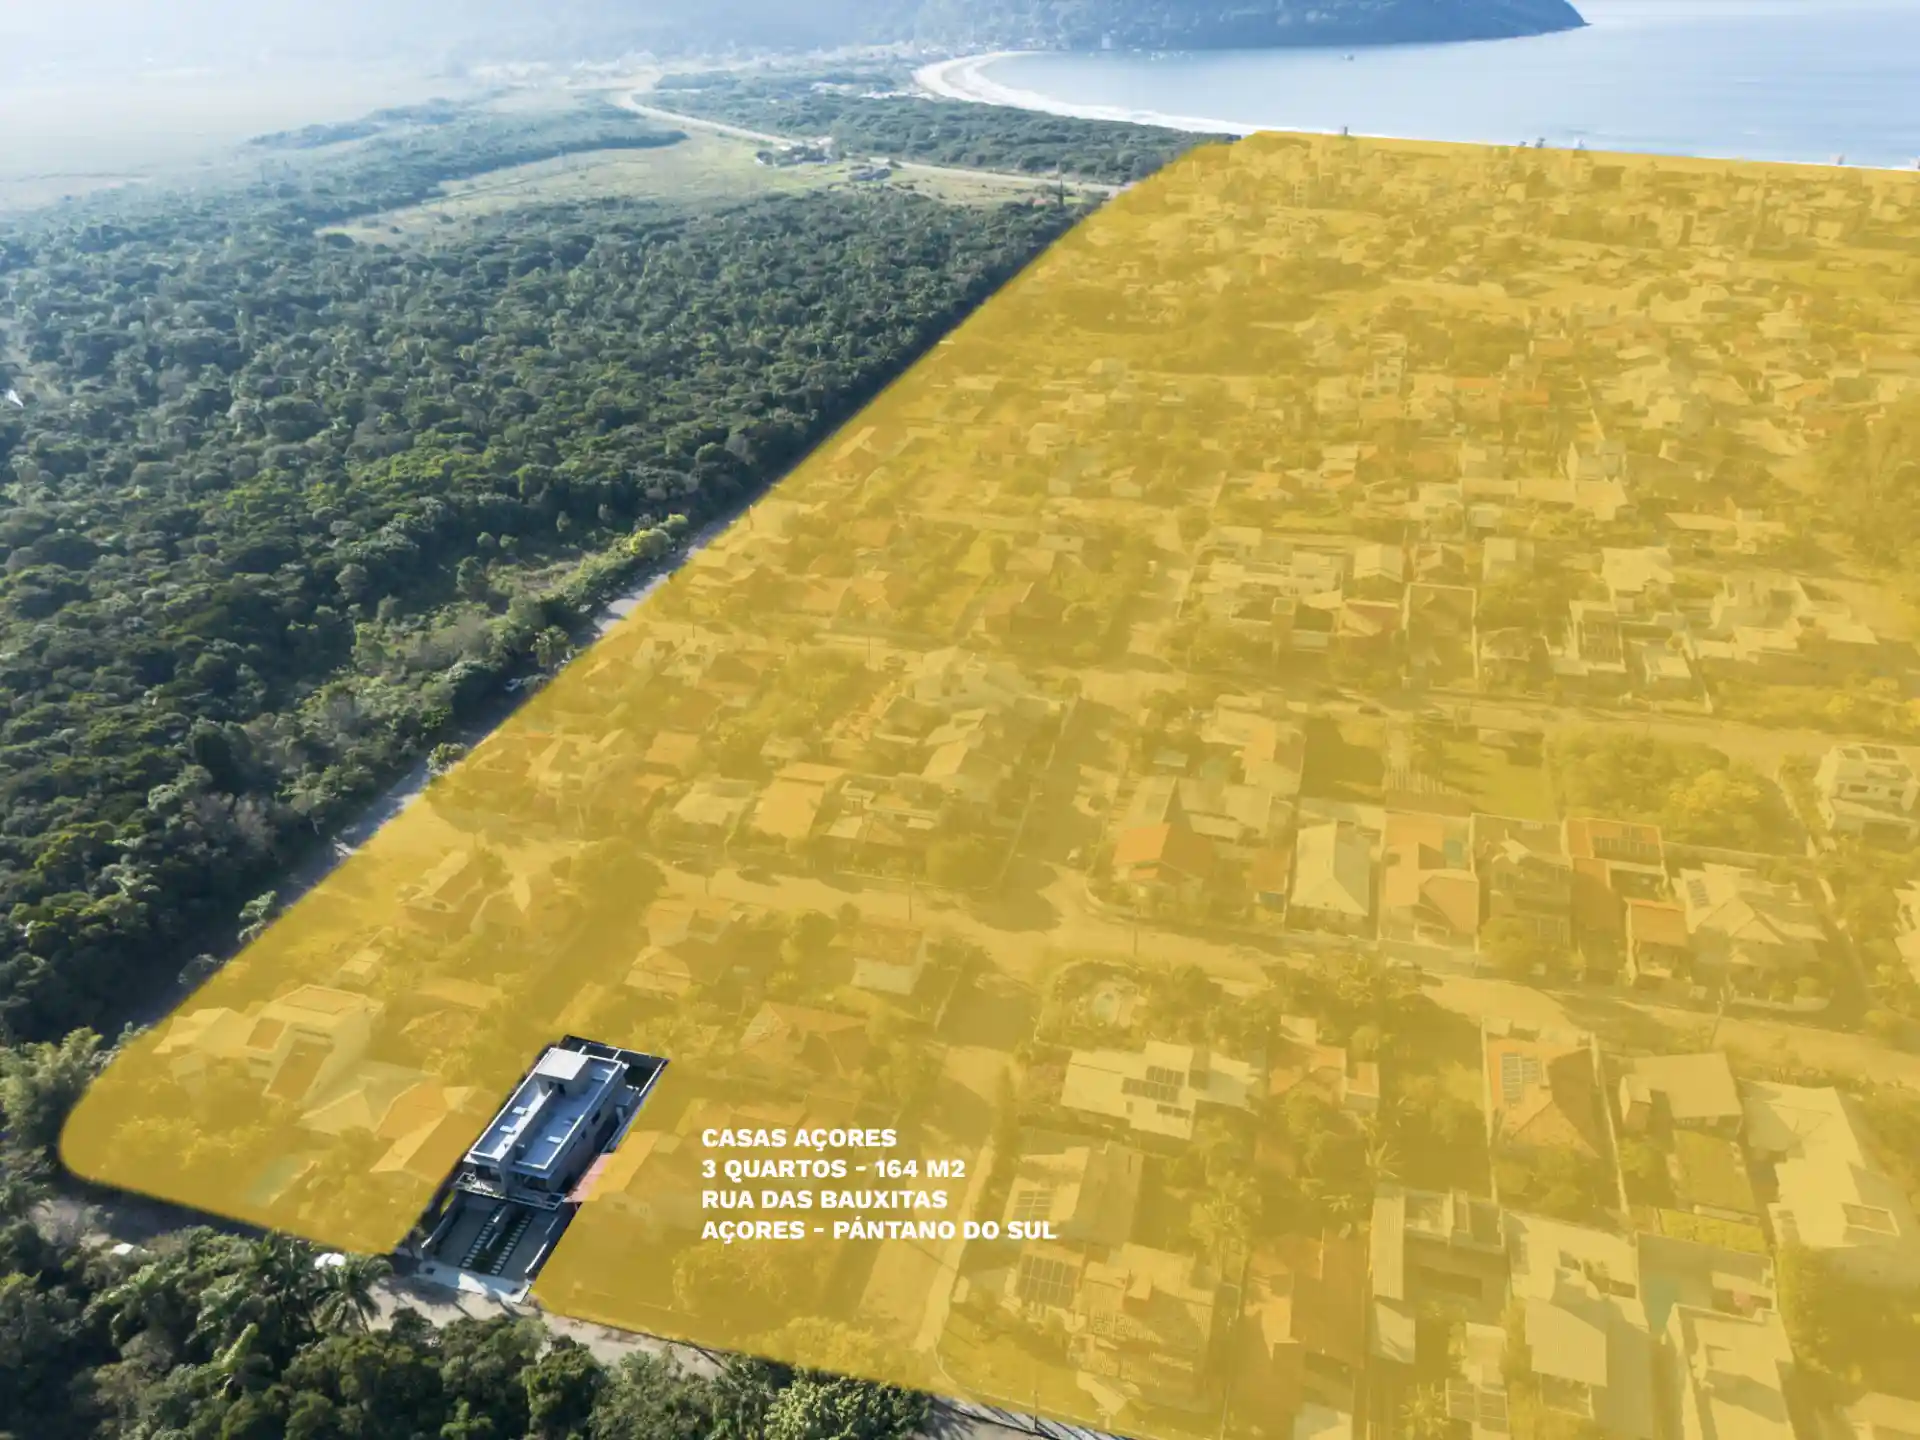
The useful way to read Florianópolis is from the property outward. Start with the exact asset, then the street and district, and only then use a citywide indicator for context. Reversing that order can make a broad average look more precise than it is.
A city of linked micro-markets
“Florianópolis” can describe very different purchase decisions: an apartment close to employment and services, a beach-oriented second home, a lower-density house in the South, or a property on the continental side. Those assets do not share one buyer pool, building pattern or daily-life proposition.
Three layers matter before a price comparison becomes useful:
- The property: house or apartment, private and land area, age, condition, legal building record and shared costs.
- The micro-location: access, services, topography, exposure, beach relationship and the surrounding pattern of development.
- The title and planning context: what the matrícula records, what may legally be used or built, and whether environmental or federal-land questions affect the parcel.
The municipality’s GeoPortal provides official planning and environmental consultation tools. It is a reason to investigate a parcel, not a shortcut to a legal conclusion: automated mapping must still be reconciled with the current title, municipal records and professional review.
What the June 2026 index actually says
The June 2026 FipeZAP residential sale report recorded an average advertised price of R$13,365 per m² for Florianópolis, a 4.75% rise in the first half of 2026 and an 8.29% rise over the preceding 12 months.
Those are useful market signals, but their definition is essential. Fipe explains that the residential index is calculated from internet listings and follows advertised prices for ready apartments in monitored cities. It is therefore:
- an asking-price index, not a record of deeds or completed sale prices;
- an apartment measure, not a citywide house-price average;
- a broad city result, not a valuation for Pântano do Sul, Açores or a single street;
- a nominal historical series, not a forecast of appreciation or return.
The report helps answer “what direction and level is the monitored listing sample showing?” It cannot answer “what should I pay for this house?”
How to examine a South Island opportunity
The South should be evaluated as a lived location and a constrained decision set, not as a slogan about scarcity. For a beach-oriented buyer, the relevant comparison may be other legal, completed houses within a realistic access radius—not every apartment advertised across the municipality.
A strong comparison set records more than price per square metre. For each comparable, note:
- whether the figure is the current asking price or a documented closing price;
- whether area means private internal area, total built area or land area;
- renovation status, parking, outdoor space and construction quality;
- distance and practical route to the beach rather than a marketing label;
- title, approved construction and any planning or environmental condition;
- the date the evidence was observed and whether the listing remains active.
Two properties can share a postcode and still be poor comparables. A compact apartment with shared amenities should not be used mechanically to price a detached house with land.
Demand signals are not an investment promise
The 12-month movement in the June index shows that advertised apartment prices rose over that measured period. It does not reveal how much sellers negotiated, how long individual listings stayed on the market, whether a house segment moved at the same rate, or what a foreign buyer will experience after currency conversion and transaction costs.
For an international buyer, a real return also depends on variables outside the index: the negotiated purchase price, exchange rate at each transfer, taxes and registration costs, maintenance, insurance, vacancy if rented, and the eventual selling costs. None of those is captured by the city headline.
The evidence-led conclusion is deliberately narrower: the monitored apartment asking market was firm through June 2026. That observation justifies closer local analysis; it does not justify a guaranteed-growth narrative.
Build an evidence stack before making an offer
A disciplined buyer can organise the decision in five files:
- Market file: dated city indicator plus current, genuinely comparable listings.
- Property file: plans, areas, specification, condition report and questions raised by inspection.
- Title file: current matrícula, seller authority, recorded burdens and the instrument required for transfer.
- Planning file: municipal consultation, approved construction and any environmental or federal-land issue.
- Money file: offer currency, exchange route, transaction costs and proof-of-funds requirements agreed with the authorised institution.
This separates the emotional case for a place from the evidence required to own it safely. Both matter, but they answer different questions.
Evidence limitations and reality check
There is no official public dataset in this guide that gives a completed-sale average for houses in Açores or a defensible price table for every Florianópolis neighborhood. We do not manufacture one from scattered listings.
The FipeZAP values above are dated, city-level advertised apartment indicators. Municipal mapping is a planning research tool, not confirmation that a specific property is compliant. Before relying on any market conclusion, commission independent legal, technical and valuation work for the exact asset. This guide is general editorial information, not a forecast, appraisal or investment recommendation.